Page 2 of 5
Re: Archive data fun
Posted: Wed Aug 10, 2011 7:49 am
by Lunkhead
Does anybody remember exactly which fight was the first fight that allowed voting for multiple songs? I don't remember unfortunately.
Re: Archive data fun
Posted: Wed Aug 10, 2011 8:08 am
by Manhattan Glutton
I don't, but I have a hunch it's the one where the % # of average votes per song went up significantly... graph that too!
Re: Archive data fun
Posted: Wed Aug 10, 2011 11:40 am
by Lunkhead
A quickly thrown together chart of average # of votes per song over time is now available here:
http://sfjukebox.org/songs/charts/avgVotesDate
There actually was a quite noticeable uptick in the average number of votes per song at one point in time (July 2nd, 2008), which is when the "All We Could See At The Window" fight ended. With a little poking around on the boards I was able to determine that was in fact when Spud released the new multi-voting functionality. Very interesting.
Also interesting is that it looks to me like (and this is just a subjective thing from looking at the chart, not anything based on real analysis) the chart has three sections: 2003-2006, sustained avg. # of votes per song; 2006-2008, steadily declining avg. # of votes per song; 2008-present sustained avg. # of votes per song, at a level higher than the 2003-2006 period.
This old discussion was interesting, too. I'd forgotten about it, so it's kind of neat to look at it and also look at the data a few years on.
http://songfight.net/forums/viewtopic.php?f=12&t=5519
Re: Archive data fun
Posted: Wed Aug 10, 2011 12:24 pm
by Manhattan Glutton
Lunkhead wrote:2006-2008, steadily declining avg.
My hiatus years. Coincidence? I think not.
Re: Archive data fun
Posted: Thu Aug 11, 2011 7:58 am
by JonPorobil
The first multi-vote fight was "Walking the Border."
Re: Archive data fun
Posted: Thu Aug 11, 2011 8:12 am
by Lunkhead
Ah yes, you're correct, according to the review thread for that fight. Also on the chart June 20th is actually the fist data point of the elevated 2008-present section, so higher average votes per song still correlates with multi-voting. For some reason my mouse was only hovering over the points right after or before that until I really tried to get that one to show up just now, knowing it had to be there somewhere.
Any other graph ideas?
Re: Archive data fun
Posted: Tue Aug 23, 2011 12:41 am
by Billy's Little Trip
Can I say retarded stuff yet and be a dickhead? I've waited a long time, Lunk. 2 pages? You need some BLT. This thread is like watching paint dry.

edit:
Oh wait, I just posted in here. My work is done. No need to answer the above, Lunkhard.
edit2: sorry, Linkhead?
edit3: Forgive me, lamp...........heard?
Wait! I know this!......HumpBed!......right?

Fine, I can't say it right, but you know who you are!
Re: Archive data fun
Posted: Tue Aug 23, 2011 11:01 am
by fluffy
I just saw the percentile charts. Pretty neat, but it seems like a histogram (showing the distribution of the number of fights in each percentile rank) would be a bit more useful, especially for the huge-number-of-entry artists. Also, a line chart isn't the right presentation for the historical percentile data, since it implies an interpolation between data points that is meaningless. Really it should be an x,y scatterplot. Maybe the size of the dot could be used to indicate the total number of votes or entry count or something, too.
Re: Archive data fun
Posted: Tue Aug 23, 2011 1:00 pm
by Lunkhead
Cool, I will try all that stuff when I have time, maybe tomorrow. Thanks fluffy!
Re: Archive data fun
Posted: Tue Aug 23, 2011 2:17 pm
by king_arthur
While you're poking at stuff... although the X-axis is labeled with dates, it is not scaled by date - if somebody didn't enter a fight for a whole year and then entered six fights in a row, those fights are all evenly spaced. If you look at my chart, you can see where there are a couple points on the X-axis that are VERY close, from when we had that ten-title enter-all-you-want fight.
Charles (KA)
Re: Archive data fun
Posted: Tue Aug 23, 2011 2:40 pm
by Lunkhead
I didn't realize you entered every one of those "SONG FIGHT!" fights. Way to mess up my chart!

Seriously, though, I'm using Google's Chart API and as far as I can tell it doesn't really provide fine grained enough control to fix that issue, KA.
http://code.google.com/apis/chart/
What I would like to do is tell the API that the vertical axis is time, and specify the left and right boundary dates, and have it place the data points accordingly. It really seemed like that is not possible. I will probably switch over to this API at some point, which should be more configurable:
http://code.google.com/p/flot/
Re: Archive data fun
Posted: Tue Aug 23, 2011 6:41 pm
by Lunkhead
fluffy wrote:I just saw the percentile charts. Pretty neat, but it seems like a histogram (showing the distribution of the number of fights in each percentile rank) would be a bit more useful, especially for the huge-number-of-entry artists. Also, a line chart isn't the right presentation for the historical percentile data, since it implies an interpolation between data points that is meaningless. Really it should be an x,y scatterplot. Maybe the size of the dot could be used to indicate the total number of votes or entry count or something, too.
I'm not sure the histogram is all that useful. I've got it coded but not on my server yet. Looking at it, the "number of fights in each percentile rank" is almost always 1 for every song for every artist. It doesn't look like grouping it into deciles would make it more informative, either. I'll try the scatter plot, maybe that will work better.
Re: Archive data fun
Posted: Tue Aug 23, 2011 6:50 pm
by fluffy
Well, I meant grouped into buckets, yeah. Maybe adjust the bucket size based on the number of fights or something (log_2 of fight count, maybe). Obviously a raw percentile histogram isn't very meaningful for such a small number of data points.
Re: Archive data fun
Posted: Tue Aug 23, 2011 7:35 pm
by Lunkhead
As I said, I'm pretty ignorant about statistics and data presentation. I don't mind learning stuff by trial and error, but I also don't mind if you want to spell things out for me.

Anyway, grouping into deciles seemed to produce more interesting results. I've put that new chart on the site as the new default chart for artists. Here are some examples:
http://sfjukebox.org/artists/chart/Paco+del+Stinko
http://sfjukebox.org/artists/chart/Melvin
http://sfjukebox.org/artists/chart/MC%20Frontalot
I'll probably try the scatter plot thing tomorrow. Whee!
Re: Archive data fun
Posted: Tue Aug 23, 2011 7:38 pm
by fluffy
unsurprising but :(
(and yes that is much more useful)
what I mean by using log_2 is that for example you'd need 4 fights to have 2 buckets, 8 fights to have 3 buckets, 16 fights to have 4 buckets, etc.
Re: Archive data fun
Posted: Tue Aug 23, 2011 7:45 pm
by fluffy
Oh! Another neat thing would be if you could stack multiple artists together, and have each one's contribution color-coded, like this only less stupid:
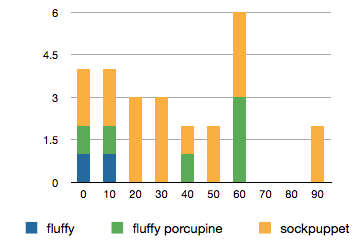
- Screen Shot 2011-08-23 at 7.44.51 PM.png (13.84 KiB) Viewed 1856 times
Re: Archive data fun
Posted: Tue Aug 23, 2011 8:36 pm
by king_arthur
Lunkhead wrote:I didn't realize you entered every one of those "SONG FIGHT!" fights. Way to mess up my chart!
I think there were three or four of us who entered all ten fights. Actually, I entered all ten, but my "Terror In Tiny Town" never seemed to make it to the fightmasters, who were probably going completely nuts trying to get all the songs posted. So I only show up in nine.
The chart as it is is still very cool, thanks for all the work you're doing!
Charles (KA)
Re: Archive data fun
Posted: Tue Aug 23, 2011 8:42 pm
by Lunkhead
log_2... I think I can switch it to that pretty easily, may give it a shot tonight, or more likely tomorrow.
Stacked column charts with multiple artists would be neat. Unfortunately the way I'm doing things right now is all very kludgy and hacky and not very flexible. Maybe what I could also do is just load the raw data into a public Google spreadsheet...? I could even write code to update it when I update the jukebox. I wonder if people could then go to town making their own charts and graphs with the data. The only totally public spreadsheet I've seen was not editable, so maybe that wouldn't be very useful.
Re: Archive data fun
Posted: Tue Aug 23, 2011 8:49 pm
by Lunkhead
fluffy wrote:what I mean by using log_2 is that for example you'd need 4 fights to have 2 buckets, 8 fights to have 3 buckets, 16 fights to have 4 buckets, etc.
Actually, I don't think I get it still. If somebody had one song, their song would go in the 0-100 percentile bucket...? If they had four songs, they'd be split into the 0-X and Y-100 buckets...? Plus then no one would ever have over 7 buckets. I'm not sure that sounds useful, so I'm probably not understanding it correctly. It seems like having hte same buckets for everybody gives a common reference point for comparing artists. Having different buckets for different artists would seem to remove that common reference point.
Re: Archive data fun
Posted: Tue Aug 23, 2011 9:05 pm
by fluffy
If they only have one song then it's not that useful to know what their percentile distribution is to begin with. Anyway it's something tunable. Maybe it should be something based on confidence intervals, or something. I am not a statistician.
Re: Archive data fun
Posted: Tue Aug 23, 2011 9:44 pm
by Lunkhead
Anybody have any thoughts about the Google spreadsheet idea?
Re: Archive data fun
Posted: Tue Aug 23, 2011 9:46 pm
by fluffy
Well, the point to having the stacked data was to aggregate multiple artist names for a single participant (and to see how much better each name did than the others). There isn't much point to having an overall stacked histogram for EVERY artist because it will by definition just be a flat line without much to differentiate individual artists within the columns.
If you just want to export all the raw data, why not provide it as a CSV?